- The Big Data Crystal Ball: Best Practices of Prediction, Application, Marketing and Research January 21, 2019
-
Last year, Korea suffered from unusually hot weather and everyone wondered when the heat would ever subside. One radio host, fatigued from the unrelenting heat, asked when will the extreme heat begin to recede and Dr. Jaewon Choi (’95, Computer Science), Director of Daumsoft, a leading technology company in Korea, estimated when this might happen using big data analysis, and he turned out to be right. He was subsequently bombarded with calls from many interested parties ranging from the Korea Meteorological Administration to soft drink companies ensued.
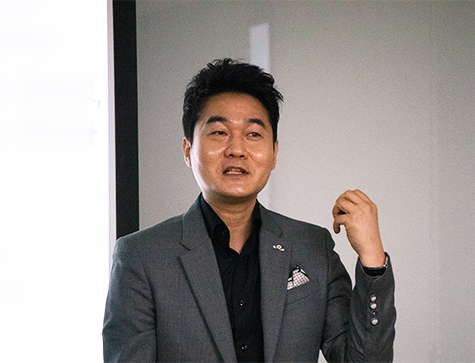 Dr. Jaewon Choi (’95, Computer Science), Director of Daumsoft
With everyone eager to gaze into the big data crystal ball, Dr. Choi, one of the most sought-after experts in the field, tried his best to explain to the general public the complicated concepts and everyday application of big data in easy-to-understand terms.
The lecture he gave on November 7, 2018, at a forum administered by the Business Research Institute at Yonsei University in Seoul, Korea provides meaningful insights on Korean society seen through the lens of big data analysis. The following is a summary of the translated version of the lecture.
We live in a world where the old adage "Seen one, you've seen them all" no longer applies. We no longer watch the same TV shows and read the same newspapers as our neighbors. Instead, we get the Youtube feed of our choice channels and follow the timeline of our friends, who are most likely to have similar opinions and preferences of ours. We actually need to see them ‘all’ to really see them all. In this sense, the survey method of extracting information from a sample is becoming less reliable, while big data analysis, which examines the whole accumulated data, is getting more and more popular.
In order to avoid the intrinsic problems of surveys such as respondents not sharing their honest opinions in consideration of how they would look in the eyes of the surveyor, companies nowadays are more focused on trying to understand consumer tendencies by observing consumers’ behavior rather than approaching them directly. For example, an interesting correlation between user profiles on social media and consumer behavior has been found. People who post ancient Chinese idioms or philosophical phrases on their profiles tend not to respond to marketing campaigns, while people who post photos with beautiful scenery and mountains in the background tend to respond favorably in comparison. Since image and text analysis is possible at the current level of AI technology, predictive analytics based on this kind of insight are now used for corporate target marketing.
There are many big data marketing examples of correlations being used for marketing purposes. The New York Mets found a tendency that once becoming a fan of a particular baseball team, a person usually stays a fan until the rest of their life. An analysis of the existing fan base of the New York Mets revealed that many fans were born in 1962 and 1978. This data was then mapped to their wins in the World Series championship, in 1970 and 1986 respectively. Through the analysis, it became clear that 8-year-old children became enthusiastic fans in the years when the team won the World Series championship. Since other famous baseball teams were in a similar situation, baseball teams who win the World Series now have relatively accurate information about which age group they should focus on in order to expand their fan base.
Unlike the traditional methods for statistical analysis, one of the big advantages of big data analysis is the ability to discover causal relationships beyond simple correlations. Large US supermarkets and department stores analyze the pattern of consumer behavior and its causes to predict the behavior of individual consumers and create big data marketing forecasts. For example, after his daughter in high school started receiving pregnancy and childbirth-related coupons from a supermarket, a father filed a complaint only to find out later that his daughter was actually pregnant. By analyzing the changes in purchasing behavior of the daughter, the supermarket estimated that the girl was pregnant long before the father could realize it. In the supermarket, they monitored the daughter’s behavior and noticed that she had changed the shampoo, soap and lotion she had previously used to products without any scent. In the following month, after the girl also switched to a scented soap usually purchased by pregnant women, the supermarket assumed that she was pregnant and started sending her coupons for pregnant women.
However, data analytics alone is not a perfect prediction tool that works anytime, anywhere. Analysis and estimation are one thing, but precise interpretation and prediction require consideration of broader factors such as socio-cultural context, psychology, and philosophy. For example, in the 2018 local elections in South Korea, there was a case in which it was estimated that a certain candidate would be elected based on the fact that their name appeared more than other candidates in online searches, but in the end, he was not elected. The prediction was made based on the fact that Trump’s name appeared more in search engines than Hilary’s in the US presidential elections in 2016 and was actually elected, but in this case, the prediction was wrong because it did not consider the differences in political culture between the US and South Korea. In the case of the United States, people usually search information about the candidates they support, while in Korea a lot of people conduct searches about the candidates they do not support and write negative comments about them on internet websites and blogs.
Therefore, I decided not to apply foreign indicators directly to Korea. Instead, I wondered what would be the best representation of the happiness index for Korea in consideration of the context of Korean society, and developed the chicken index in 2016. In Korea, chicken is a word that signals ‘happiness’. Usually, if the figure of correlation is above 0.4, it is considered that there is a correlation. The correlation between chicken and happiness in Korea is very high, at 0.78. In Korean social media, chicken is mentioned online about 50,000 a day, which makes it the single most regularly mentioned topic that exceeds 50,000 on a daily basis. Fine dust saturation, even on its worst days, reaches only about 20,000 mentions, and the only other issue that has recently reached 50,000 mentions was the inter-Korean summit. This is why in Korean data analytics, it can be estimated whether something is a hot topic or not based on how the number of mentions compares to that of chicken. (These days, the boyband BTS has a higher rate of mentions than chicken.) Since weather and economic conditions are factors that contribute to the happiness index, I combined these three factors – chicken mention rates, weather (humidity, fine dust, temperature), and market capitalization – into one, the chicken index, and launched it at 1000 points. The 2018 inter-Korean summit accumulated 3000 points, while the latest record of 3400 points was reached on the day when Korea won against Germany at the World Cup. If companies and organizations utilize indicators such as the chicken index, which represents a combination of internal and external data, information about stakeholders and their current situation can be grasped more accurately and utilized as a reference for decision making.
-
SINCHON·INT′l
SINCHON·INT′l
- MIRAE
show mobile menu
mobile menu